
AI KPIs in Jira Reporting: Measuring Whether AI Is Actually Working

Every engineering leader I talk to right now is asking the same question: “We’ve rolled out AI coding tools — how do we know if they’re working?”
The honest answer, more often than not, is that they don’t know. They have anecdotes. A developer who says Copilot saved them two hours on a refactor. A tech lead who feels like the last sprint went faster. Maybe a LinkedIn post from another company claiming a 40% productivity boost with no methodology attached.
Anecdotes aren’t evidence. And in an enterprise context, “it feels faster” doesn’t survive a quarterly business review.
The good news is that most organizations already have the data they need. It’s sitting in Jira, captured through normal delivery workflows, waiting to be structured into something meaningful. The challenge isn’t collecting new data — it’s asking the right questions of the data you already have.
The Core Problem: You Can’t Measure AI Impact Without a Baseline
This is where most AI measurement efforts fail before they start. A team rolls out an AI coding assistant, watches their velocity chart for two sprints, sees a bump, and declares victory. But velocity fluctuates naturally. Maybe they had fewer interruptions that sprint. Maybe the stories were simpler. Maybe someone came back from vacation.
Without a defined pre-AI baseline — captured over a meaningful window, typically six sprints minimum — you have no control group. You’re staring at noise and calling it signal.
Establishing a baseline means snapshotting your team’s velocity, cycle time, defect density, and rework rate before AI tooling is introduced. Store it somewhere versioned. Write down the team composition, the sprint range, and any notable context. You’ll thank yourself in three months when someone asks, “Compared to what?”
What to Measure: System Performance, Not Individual Output
The moment you start measuring “how productive is Developer X with AI?”, you’ve lost. Developers will game the inputs, data quality will collapse, and you’ll learn nothing useful. The entire framework has to be oriented around team-level delivery health.
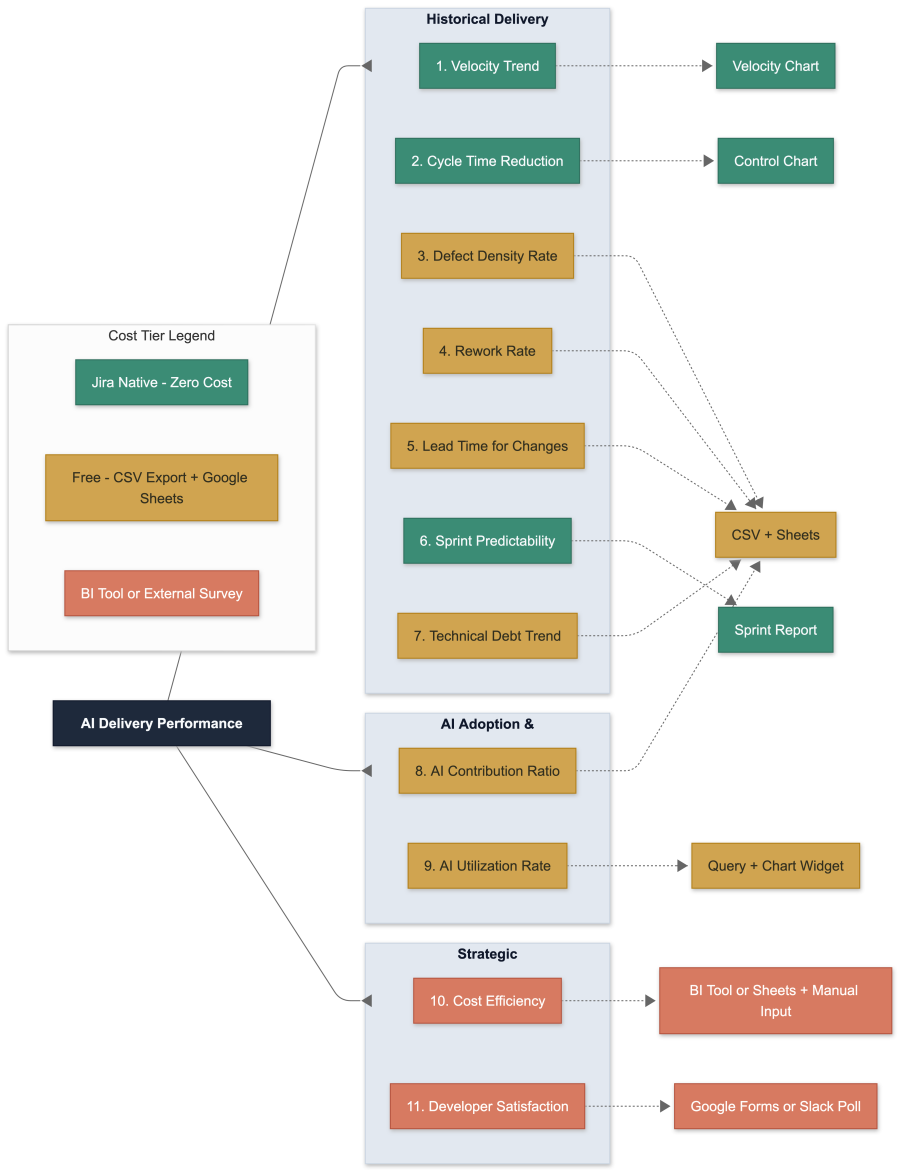
There are eleven metrics that, taken together, give you a complete picture. They fall into three categories.
Historical delivery health covers what your team was already doing — velocity trends, cycle time, defect density, rework rate, lead time, sprint predictability, and technical debt share. These are the fundamentals. They tell you whether your delivery engine is healthy, independent of any AI discussion.
AI adoption and impact answers two specific questions: How much of your delivered work involved AI? And how consistently are teams actually using the tools? The first is your contribution ratio — the share of completed story points that had AI involvement. The second is your utilization rate — the percentage of stories where AI was used at all. Together, they separate usage from impact. A team can have 90% utilization but zero velocity improvement; that tells you AI is adopted but not effective for their workload.
Strategic ROI closes the loop for leadership. Cost efficiency — your effective cost per story point, factoring in AI tooling licenses alongside team cost — answers the “is it worth it?” question directly. Developer satisfaction, captured through a lightweight quarterly survey, explains the why behind the numbers. Low utilization with high satisfaction means a process or policy blocker. Low utilization with low satisfaction means a training or trust problem. The qualitative signal tells you where to intervene.
The Tagging Problem (And Why It Matters More Than You Think)
None of this works without a clean mechanism to distinguish AI-assisted work from non-AI work. In Jira, this means a combination of labels for quick filtering and custom fields for enforceable, structured data.
The label approach is fast and low-friction: tag a story ai-assisted and you can immediately split your dashboards. But labels are free-form. Within weeks, you’ll find AI-assisted, ai_assisted, aiassist, and six other variants polluting your reports. Label drift is not a theoretical risk — it’s an inevitability unless you actively govern it.
The structured field approach is more robust: a required-at-close dropdown or checkbox that forces a developer to declare whether AI was used before they can transition a story to Done. This gives you clean, enforceable, reportable data. The tradeoff is slightly more friction at story completion, but in practice, a single “Yes/No” click adds negligible overhead.
The best approach uses both. A small set of custom fields (four is enough) provides the hard data for KPI computation. Labels provide the convenience layer for ad-hoc filtering and quick dashboard views. Automation rules keep them in sync.
The Honest Limitations of Jira’s Native Reporting
A common misconception is that you can build this entire measurement framework inside Jira using native gadgets. You can’t.
Jira’s built-in analytics are genuinely useful for a subset of metrics. The Sprint Velocity Chart shows story points per sprint out of the box. The Control Chart shows cycle time distribution. Sprint Reports show planned vs. delivered. These cover maybe three or four of the eleven metrics natively.
Everything else — defect density (which is a ratio across issue types), rework rate (a percentage of a filtered population), lead time percentiles, cost efficiency, and AI contribution ratios — requires a calculation layer outside Jira. This can be as simple as a Google Sheet fed by CSV exports, or as sophisticated as a BI tool like eazyBI or Power BI. But it’s important to be honest about this upfront, because setting up a dashboard of native Jira gadgets and calling it “AI KPI reporting” will give you an incomplete and potentially misleading picture.
The practical path for most teams: start with native widgets for what they cover, add a spreadsheet-based calculation layer for the computed metrics, and graduate to a BI tool only when you’re managing three or more teams.
Selection Bias: The Elephant in the Room
Here’s a risk that almost nobody talks about in AI productivity measurement: developers self-select which stories get AI assistance. If a developer instinctively reaches for Copilot on a straightforward CRUD endpoint but handles a complex legacy integration manually, your “AI stories” cohort is structurally different from your “non-AI stories” cohort. Comparing their cycle times isn’t comparing AI vs. non-AI — it’s comparing easy vs. hard.
This doesn’t invalidate the measurement, but it means you need to be thoughtful about how you interpret the data. At minimum, check whether AI-assisted stories cluster at lower story point values than non-AI stories. If they do, normalize before comparing. Better yet, compare within complexity tiers: AI stories at 3 points vs. non-AI stories at 3 points. Best case, compare the same team against its own pre-AI baseline on comparable work, which sidesteps the selection problem entirely.
What the Decision Matrix Looks Like
After six sprints of clean data, you can read the signals:
If velocity is climbing, cycle time is dropping, and defects are flat or falling — AI is delivering value. This is the ideal signal. You can invest further with confidence.
If velocity is climbing but defects are rising — you’re buying speed at the expense of quality. Dig into rework rates and contribution levels. AI-generated code may be shipping without adequate review.
If utilization is low and developer satisfaction is also low — you have a training or trust problem. The tools aren’t being used because people don’t believe they help. Investment should go into enablement, not more tooling.
If utilization is high but velocity is flat — AI is adopted but not impactful for this team’s work profile. Look at which agent types are being used and what kind of work is being done. AI excels at some tasks and adds nothing to others.
These are the four patterns that show up consistently. Each one points to a different intervention. The whole point of the framework is to tell you which one you’re in so you stop guessing.
Start Simple, Evolve Gradually
The temptation with any measurement framework is to build the whole thing at once. Don’t. Start with the five historical metrics, establish your baseline, add two or three custom fields, and build one dashboard. Run it for six sprints before drawing any conclusions. Add AI-specific metrics only after your baseline is solid and your field discipline is established.
Monthly reviews, not daily. Trends, not snapshots. System performance, not individual scorecards.
If, after a quarter, velocity is up, cycle time is down, and defects haven’t spiked — you have your answer. AI is working. And you have the data to prove it.